SVCモデルのSHAP値
目的
前回線形サポートベクタマシン(LinearSVM)、非線形サポートベクタマシン(SVM)を利用したサッカー試合予測モデルを作ったが精度が良くなかったので改善策を考えたいと思う。
試み
SVMによる予測のSHAP値を計算して、ウォーターフォール図を見てみる。
shapモジュールのwaterfall_plotを利用しようとするとエラーが発生した。
このスレッドを参考にして、KernelExplainerでラップすることでプロットできるようになった。
コードは以下のようになる。
from sklearn.svm import LinearSVC
from sklearn.pipeline import make_pipeline
from sklearn.preprocessing import StandardScaler
from sklearn.datasets import make_classification
from sklearn.model_selection import train_test_split
from sklearn.metrics import accuracy_score
import shap
shap.initjs()

df = data_catalog.load('features')
display(df.head(3))
df_cat = None
for col in ['HomeTeam', 'AwayTeam']:
    tmp = pd.get_dummies(df[col], prefix=col)
    df_cat = pd.concat([df_cat, tmp], axis=1)
cat_col = df_cat.columns.tolist()
df = pd.concat([df, df_cat], axis=1)

df['game_result'] = df['game_result'].astype('category')
df['game_result_cd'] = df['game_result'].cat.codes
display(dict(enumerate(df['game_result'].cat.categories)))

df_train, df_test = train_test_split(df, test_size=0.1, random_state=42)

feature = ['home_Season_score_index_last1',
       'home_Season_score_index_last2', 'home_Season_score_index_last3',
       'home_Season_score_index_last4', 'home_Season_score_index_last5',
       'away_Season_score_index_last1', 'away_Season_score_index_last2',
       'away_Season_score_index_last3', 'away_Season_score_index_last4',
       'away_Season_score_index_last5'] + cat_col
X = df_train[feature]
y = df_train['game_result_cd']
X_test = df_test[feature]
y_test = df_test['game_result_cd']

clf = LinearSVC(random_state=0, tol=1e-5, max_iter=10000)
clf.fit(X, y)

# KernelExplainerでラップする
explainer = shap.KernelExplainer(clf.predict, X_test)
for row in y_test.iloc[0:3].index:
    print(f'Correct: {y_test[row]}')
    values = explainer.shap_values(X_test.loc[[row]])
    tmp = shap.Explanation(values = np.array(values, dtype=np.float32),
                           base_values = np.array([explainer.expected_value], dtype=np.float32),
                           data=np.array(X_test.loc[[row]]),
                           feature_names=X_test.columns)

    shap.plots.waterfall(tmp[0])
以下が作成されたウォーターフォール図
試合結果のコード値は下記
- 0: アウェイチーム勝利
- 1: 引き分け
- 2: ホームチーム勝利
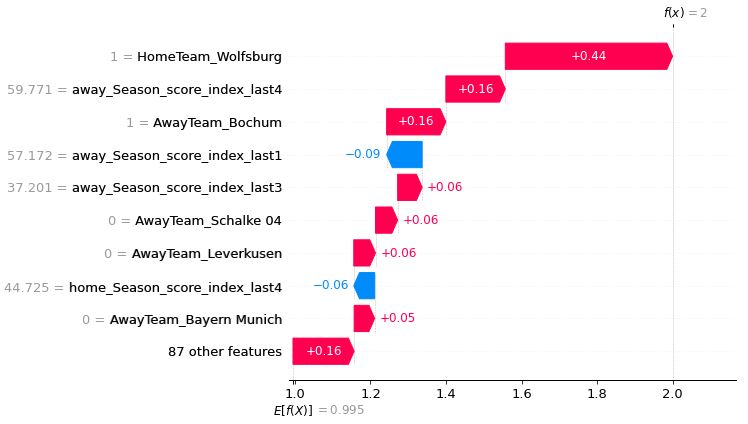
試合結果: 引き分け
予測結果: ホームチーム勝利
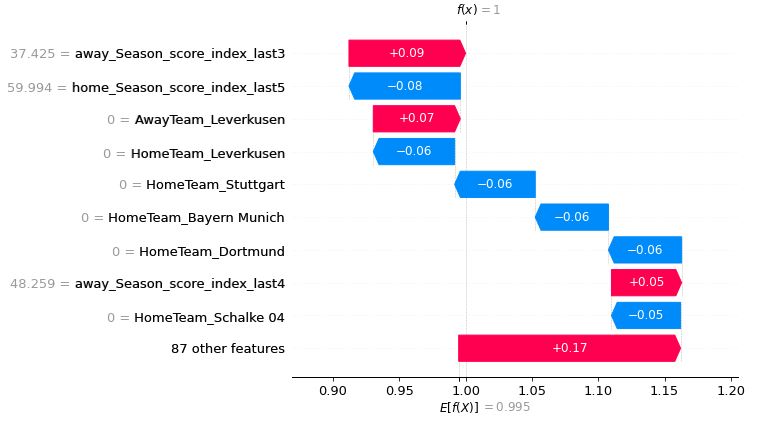
試合結果: ホームチーム勝利
予測結果: アウェイチーム勝利
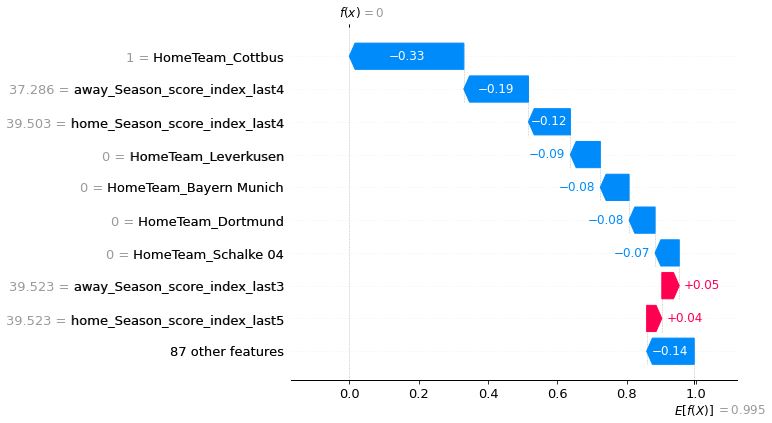
試合結果: ホームチーム勝利
予測結果: アウェイチーム勝利
考察
ホームチーム、アウェイチームのダミー変数がそこそこの影響力をもっているよう。
ホームチーム、アウェイチームのダミー変数を抜いて、過去試合スコア偏差値だけで予測したほうが汎化性能が高くなりそう。